Metrics Overview
Open Service Mesh (OSM) generates detailed metrics related to all traffic within the mesh. These metrics provide insights into the behavior of applications in the mesh helping users to troubleshoot, maintain and analyze their applications.
As of today OSM collects metrics directly from the sidecar proxies (Envoy). OSM provides rich metrics for incoming and outgoing traffic for all services in the mesh. With these metrics the user can get information about the overall volume of traffic, errors within traffic and the response time for requests.
OSM uses [Prometheus][1] to gather and store consistent traffic metrics and statistics for all applications running in the mesh. Prometheus is an open-source monitoring and alerting toolkit which is commonly used on (but not limited to) Kubernetes and Service Mesh environments.
Each application that is part of the mesh runs in a Pod which contains an Envoy sidecar that exposes metrics (proxy metrics) in the Prometheus format. Furthermore, every Pod that is a part of the mesh has Prometheus annotations, which makes it possible for the Prometheus server to scrape the application dynamically. This mechanism automatically enables scraping of metrics whenever a new namespace/pod/service is added to the mesh.
OSM metrics can be viewed with [Grafana][8] which is an open source visualization and analytics software. It allows you to query, visualize, alert on, and explore your metrics.
Grafana uses Prometheus as backend timeseries database. If Grafana and Prometheus are chosen to be deployed through OSM installation, necessary rules will be set upon deployment for them to interact. Conversely, on a “Bring-Your-Own” or “BYO” model (further explained below), installation of these components will be taken care of by the user.
Installing Metrics Components
OSM can either provision Prometheus and Grafana instances at install time or OSM can connect to an existing Prometheus and/or Grafana instance. We call the latter pattern “Bring-Your-Own” or “BYO”. The sections below describe how to configure metrics by allowing OSM to automatically provision the metrics components and with the BYO method.
Automatic Provisioning of Metrics Components
By default, both Prometheus and Grafana are disabled.
However, when configured with the --set=OpenServiceMesh.deployPrometheus=true flag, OSM installation will deploy a Prometheus instance to scrape the sidecar’s metrics endpoints. Based on the metrics scraping configuration set by the user, OSM will annotate pods part of the mesh with necessary metrics annotations to have Prometheus reach and scrape the pods to collect relevant metrics. To install Grafana for metrics visualization, set the --set=OpenServiceMesh.deployGrafana=true flag to true when installing OSM using the osm install command.
The automatic bring up can be overridden with the osm install --set flag during install time:
 osm install --set=OpenServiceMesh.deployPrometheus=true \
             --set=OpenServiceMesh.deployGrafana=true
Note that the Prometheus and Grafana instances deployed automatically by OSM have simple configurations that do not include high availability, persistent storage, or locked down security. If production-grade instances are required, pre-provision them and follow the BYO instructions on this page to integrate them with OSM.
Prometheus Integration
BYO Prometheus
The following section will document the additional steps needed to allow an already running Prometheus instance to poll the endpoints of an OSM mesh.
List of Prerequisites for BYO Prometheus
- Already running an accessible Prometheus instance outside of the mesh.
- A running OSM control plane instance, deployed without metrics stack.
- We will assume having Grafana reach Prometheus, exposing or forwarding Prometheus or Grafana web ports and configuring Prometheus to reach Kubernetes API services is taken care of or otherwise out of the scope of these steps.
Configuration
- Make sure the Prometheus instance has appropriate RBAC rules to be able to reach both the pods and Kubernetes API - this might be dependent on specific requirements and situations for different deployments:
- apiGroups: [""]
   resources: ["nodes", "nodes/proxy",  "nodes/metrics", "services", "endpoints", "pods", "ingresses", "configmaps"]
   verbs: ["list", "get", "watch"]
 - apiGroups: ["extensions"]
   resources: ["ingresses", "ingresses/status"]
   verbs: ["list", "get", "watch"]
 - nonResourceURLs: ["/metrics"]
   verbs: ["get"]
- If desired, use the Prometheus Service definition to allow Prometheus to scrape itself:
annotations:
        prometheus.io/scrape: 'true'
        prometheus.io/port: '<API port for prometheus>' # Depends on deployment - OSM automatic deployment uses 7070 by default, controlled by `values.yaml`
- Amend Prometheus’ configmap to reach the pods/Envoy endpoints. OSM automatically appends the port annotations to the pods and takes care of pushing the listener configuration to the pods for Prometheus to reach:
- job_name: 'kubernetes-pods'
   kubernetes_sd_configs:
   - role: pod
   relabel_configs:
   - source_labels: [__meta_kubernetes_pod_annotation_prometheus_io_scrape]
      action: keep
      regex: true
   - source_labels: [__meta_kubernetes_pod_annotation_prometheus_io_path]
      action: replace
      target_label: __metrics_path__
      regex: (.+)
   - source_labels: [__address__, __meta_kubernetes_pod_annotation_prometheus_io_port]
      action: replace
      regex: ([^:]+)(?::\d+)?;(\d+)
      replacement: $1:$2
      target_label: __address__
   - source_labels: [__meta_kubernetes_namespace]
      action: replace
      target_label: source_namespace
   - source_labels: [__meta_kubernetes_pod_name]
      action: replace
      target_label: source_pod_name
   - regex: '(__meta_kubernetes_pod_label_app)'
      action: labelmap
      replacement: source_service
   - regex: '(__meta_kubernetes_pod_label_osm_envoy_uid|__meta_kubernetes_pod_label_pod_template_hash|__meta_kubernetes_pod_label_version)'
      action: drop
   - source_labels: [__meta_kubernetes_pod_controller_kind]
      action: replace
      target_label: source_workload_kind
   - source_labels: [__meta_kubernetes_pod_controller_name]
      action: replace
      target_label: source_workload_name
   - source_labels: [__meta_kubernetes_pod_controller_kind]
      action: replace
      regex: ^ReplicaSet$
      target_label: source_workload_kind
      replacement: Deployment
   - source_labels:
      - __meta_kubernetes_pod_controller_kind
      - __meta_kubernetes_pod_controller_name
      action: replace
      regex: ^ReplicaSet;(.*)-[^-]+$
      target_label: source_workload_name
Metrics scraping
Metrics scraping can be configured using the osm metrics command. By default, OSM does not configure metrics scraping for pods in the mesh. Metrics scraping can be enabled or disabled at namespace scope such that pods belonging to configured namespaces can be enabled or disabled for scraping metrics.
For metrics to be scraped, the following prerequisites must be met:
- The namespace must be a part of the mesh, ie. it must be labeled with the
openservicemesh.io/monitored-bylabel with an appropriate mesh name. This can be done using theosm namespace addcommand. - A running service able to scrap Prometheus endpoints. OSM provides configuration for an automatic bringup of Prometheus; alternatively users can bring their own Prometheus.
To enable one or more namespaces for metrics scraping:
# With osm
osm metrics enable --namespace test
osm metrics enable --namespace "test1, test2"

# With kubectl
kubectl patch namespace test --type=merge -p '{"metadata": {"annotations": {"openservicemesh.io/metrics": "enabled"}}}'
To disable one or more namespaces for metrics scraping:
# With osm
osm metrics disable --namespace test
osm metrics disable --namespace "test1, test2"

# With kubectl
kubectl patch namespace test --type=merge -p '{"metadata": {"annotations": {"openservicemesh.io/metrics": null}}}'
Enabling metrics scraping on a namespace also causes the osm-injector to add the following annotations to pods in that namespace:
prometheus.io/scrape: true
prometheus.io/port: 15010
prometheus.io/path: /stats/prometheus
```
### Available Metrics
For details about what metrics are scraped from each Envoy proxy, see [Envoy's documentation](https://www.envoyproxy.io/docs/envoy/v1.17.2/operations/stats_overview). Note that OSM's default configuration only scrapes a subset of all metrics generated by each proxy.
#### Custom Metrics
To implement the [SMI metrics spec][7], OSM adds a custom WebAssembly extension to each Envoy proxy which generates the following statistics for HTTP traffic:
`osm_request_total`: A counter incremented for each request made by the proxy. This can be queried to determine success and failure rates of services in the mesh.
`osm_request_duration_ms`: A histogram representing the duration of requests made by the proxy in milliseconds. This can be queried to determine the latency between services in the mesh.
Both metrics have the following labels:
`source_kind`: The Kubernetes resource kind of the workload making the request, e.g. `Deployment`, `DaemonSet`, etc.
`destination_kind`: The Kubernetes resource kind of the workload handling the request, e.g. `Deployment`, `DaemonSet`, etc.
`source_name`: The Kubernetes name of the workload making the request.
`destination_name`: The Kubernetes name of the workload handling the request.
`source_pod`: The Kubernetes name of the pod making the request.
`destination_pod`: The Kubernetes name of the pod handling the request.
`source_namespace`: The Kubernetes namespace of the workload making the request.
`destination_namespace`: The Kubernetes namespace of the workload handling the request.
In addition, the `osm_request_total` metric has a `response_code` label representing the HTTP status code of each request, e.g. `200`, `404`, etc.
##### Known Gaps
- HTTP requests that invoke a local response from Envoy have "unknown" `destination_*` labels on metrics.
- In the demo, this includes requests from the bookthief to the bookstore.
- Metrics are only recorded for traffic where both endpoints are part of the mesh. Ingress and egress traffic do not have statistics recorded.
- Metrics are recorded in Prometheus with all instances of '-' and '.' in tags converted to '\_'. This is because proxy-wasm adds tags to metrics through the name of the metric and Prometheus does not allow '-' or '.' in metric names, so Envoy converts them all to '\_' for the Prometheus format. This means a pod named 'abc-123' is labeled in Prometheus as 'abc\_123' and metrics for pods 'abc-123' and 'abc.123' would be tracked as a single pod 'abc\_123' and only distinguishable by the 'instance' label containing the pod's IP address.
### Querying metrics from Prometheus
#### Before you begin
Ensure that you have followed the steps to run [OSM Demo][2]
#### Querying proxy metrics for request count
1. Verify that the Prometheus service is running in your cluster
- In kubernetes, execute the following command: `kubectl get svc osm-prometheus -n osm-system`

2. Open up the Prometheus UI
- Ensure you are in root of the repository and execute the following script: `./scripts/port-forward-prometheus.sh`
- Visit the following url [http://localhost:7070][5] in your web browser
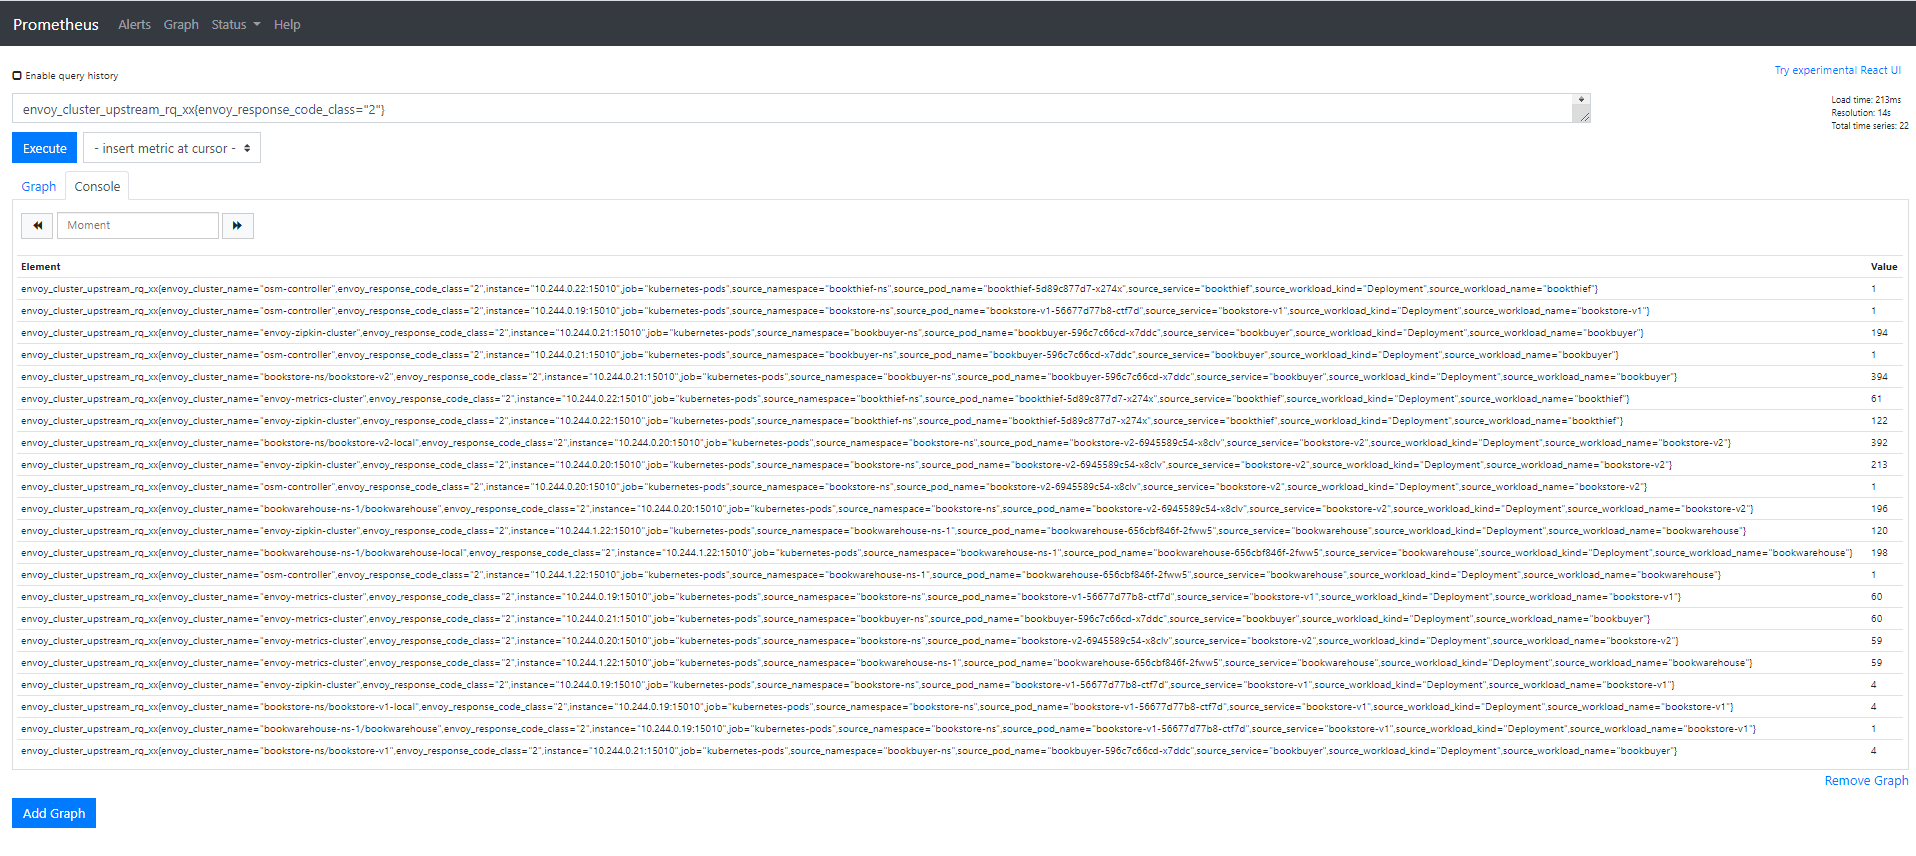
3. Execute a Prometheus query
- In the "Expression" input box at the top of the web page, enter the text: `envoy_cluster_upstream_rq_xx{envoy_response_code_class="2"}` and click the execute button
- This query will return the successful http requests
Sample result will be:
## Grafana Integration

OSM provides some pre-cooked Grafana dashboards to display and track services related information captured by Prometheus:
1. OSM Data Plane
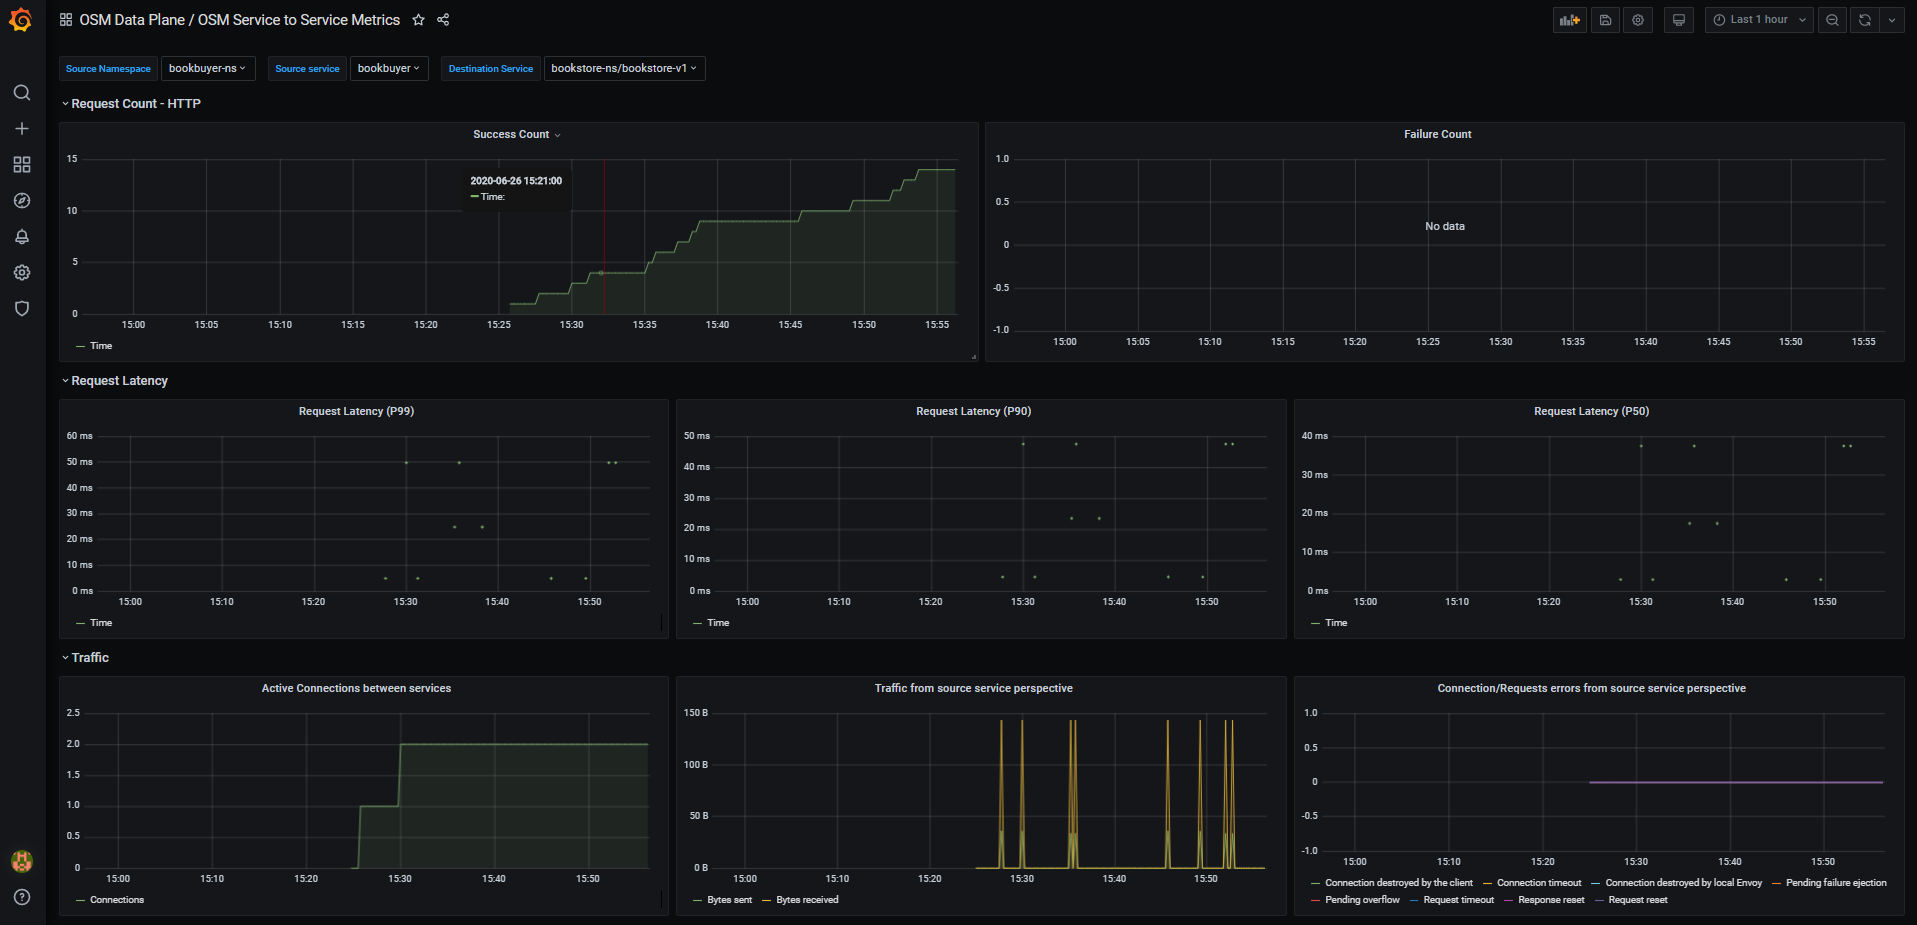
- **OSM Service to Service Metrics**: This dashboard lets you view the traffic metrics from a given source service to a given destination service
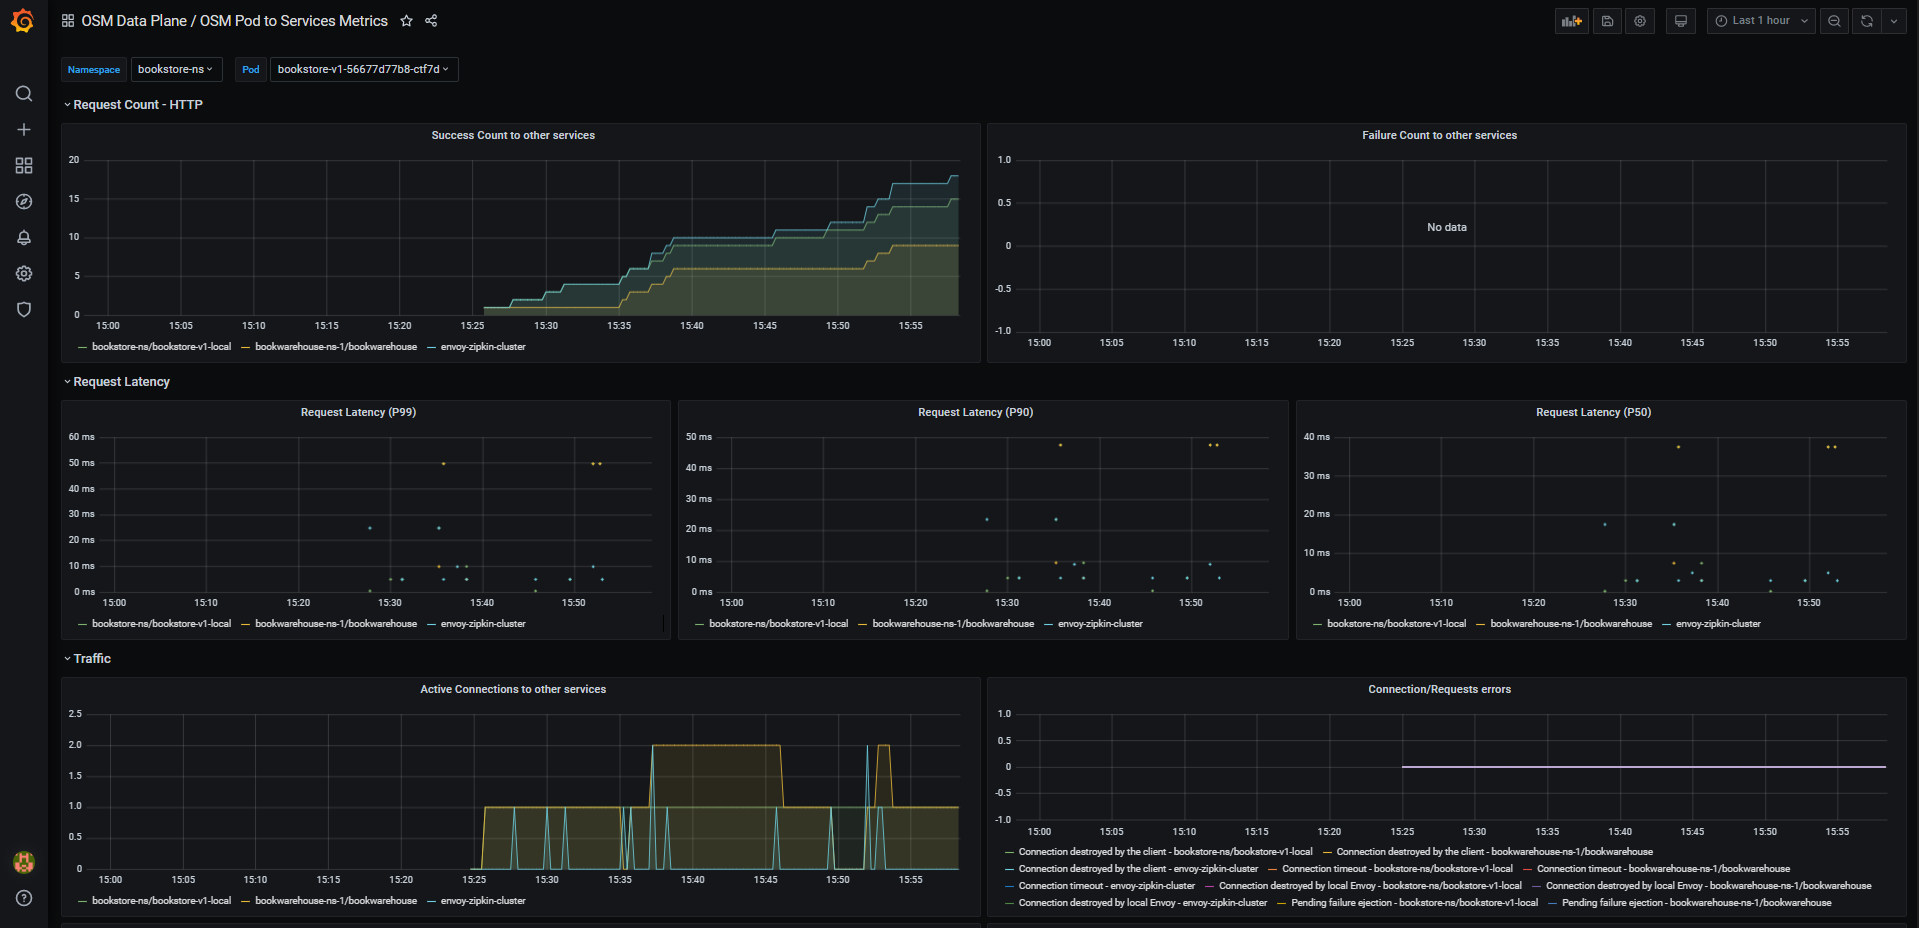
- **OSM Pod to Service Metrics**: This dashboard lets you investigate the traffic metrics from a pod to all the services it connects/talks to
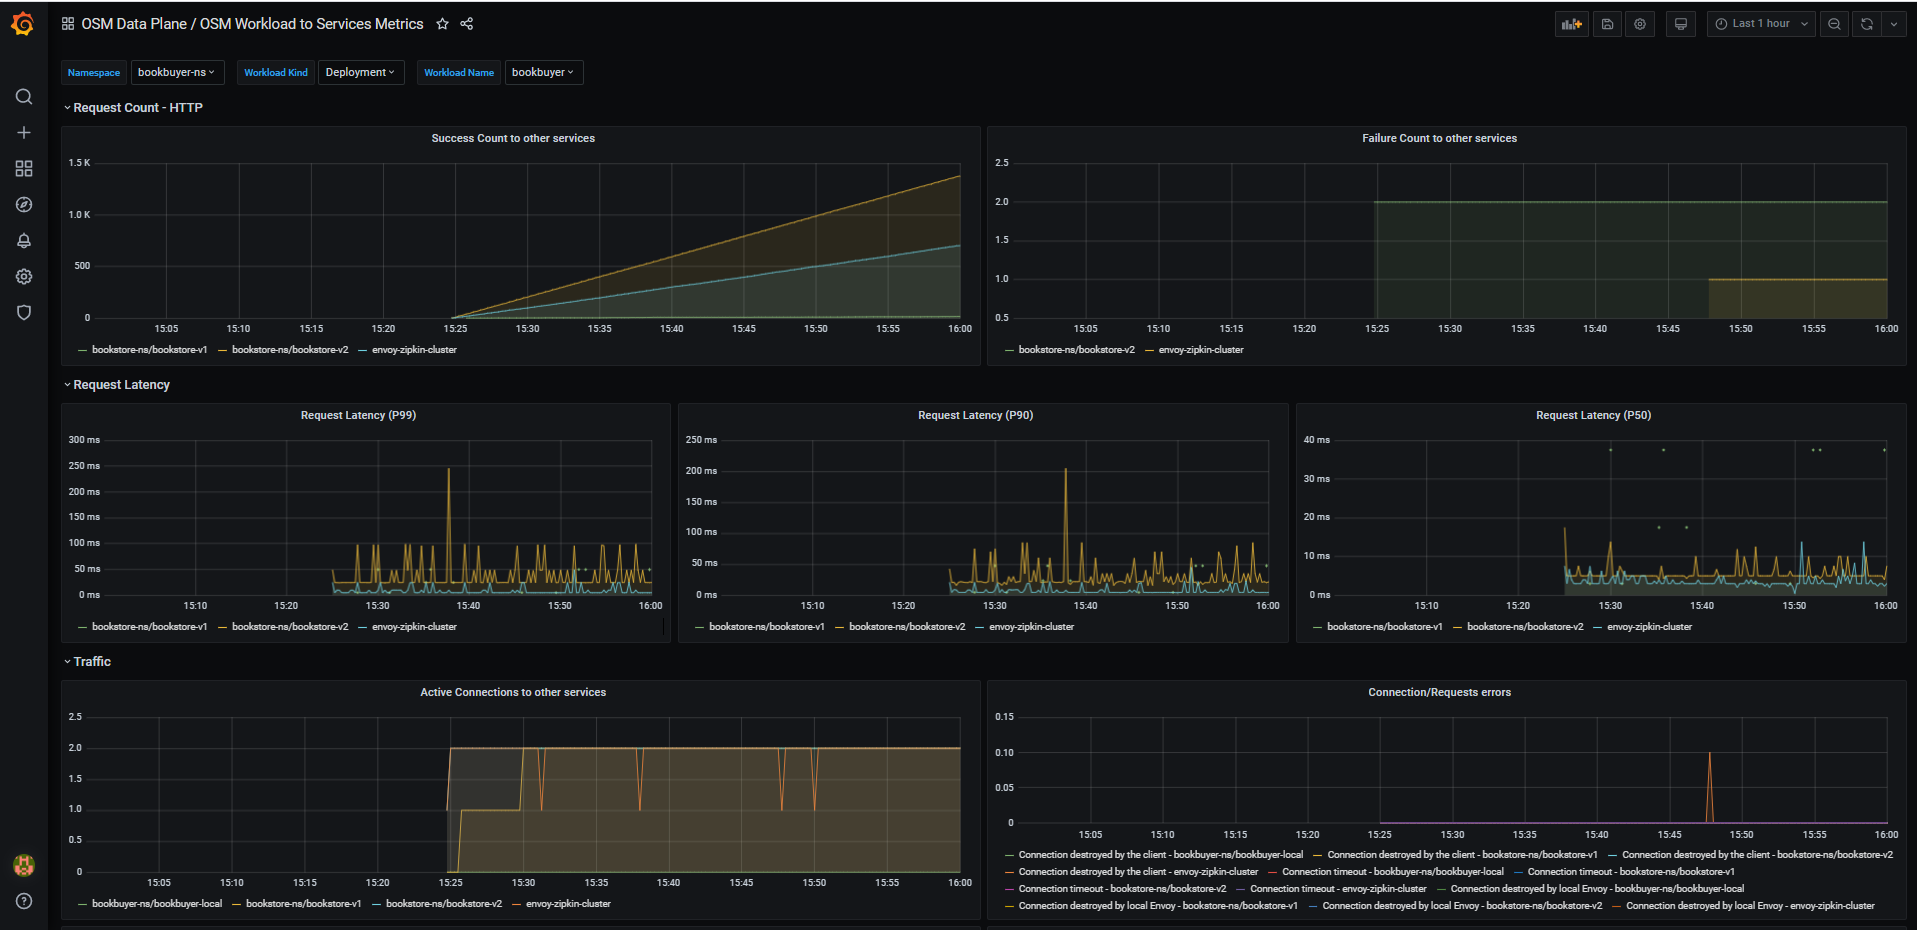
- **OSM Workload to Service Metrics**: This dashboard provides the traffic metrics from a workload (deployment, replicaSet) to all the services it connects/talks to
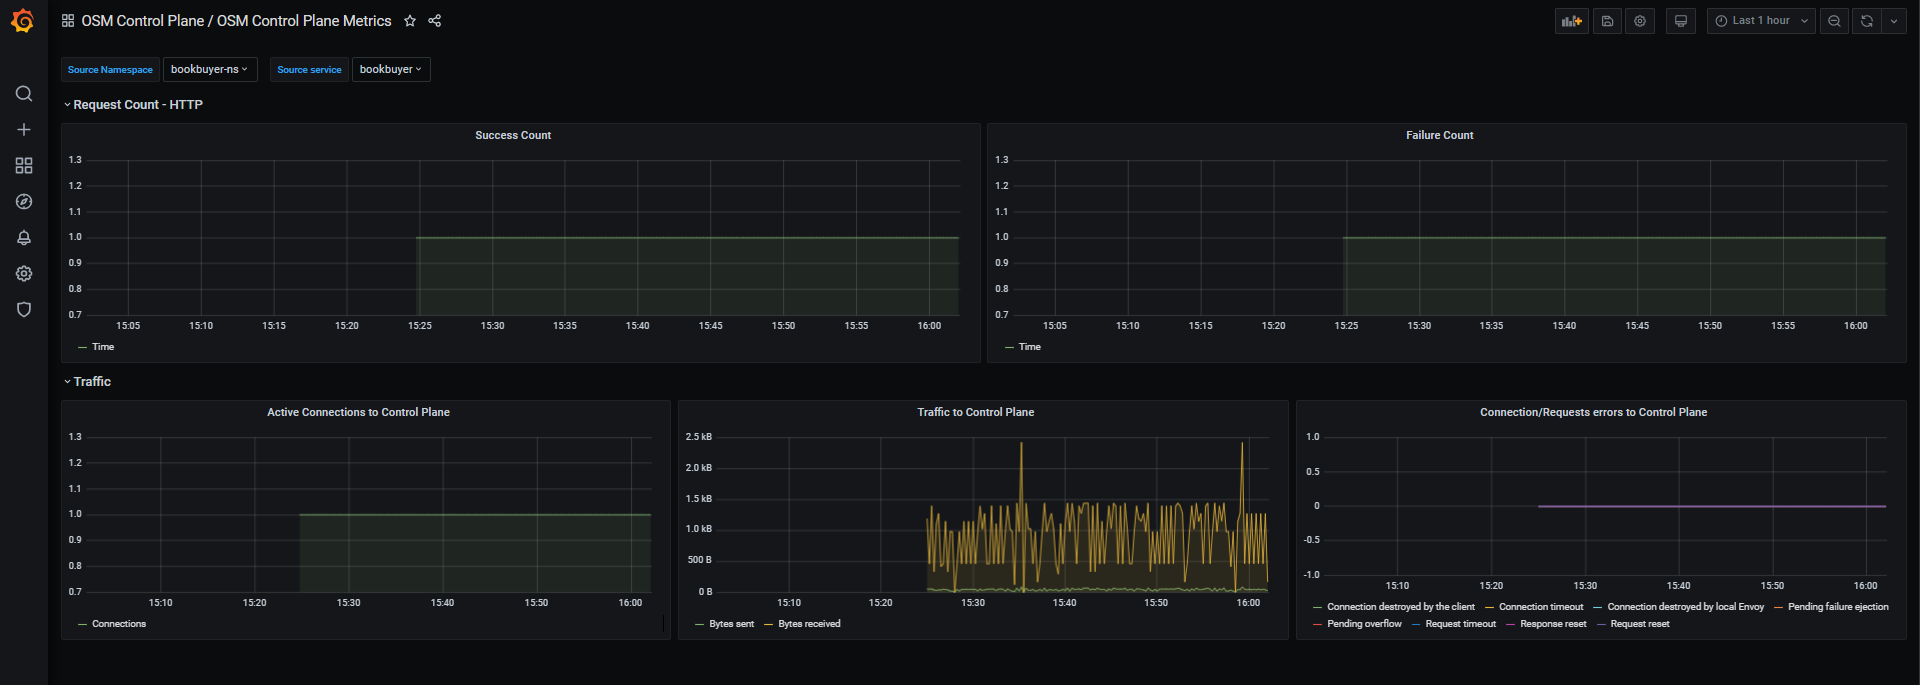
2. OSM Control Plane
- **OSM Control Plane Metrics**: This dashboard provides traffic metrics from the given service to OSM's control plane
### Importing Dashboards on a BYO Grafana instance
The dashboards (if desired) can be imported through several mechanism to the external Grafana instance.
The dashboards are located under `osm/charts/osm/grafana/dashboards` in OSM's repo, and can be imported through Grafana web json load, or either copied or mounted on the instance itself through Kubernetes volume mounts.
### Visualizing Metrics with Grafana
#### List of Prerequisites for Viewing Grafana Dashboards
Ensure that you have followed the steps to run [OSM Demo][2]
#### Viewing a Grafana dashboard for service to service metrics
1. Verify that the Prometheus service is running in your cluster
- In kubernetes, execute the following command: `kubectl get svc osm-prometheus -n osm-system`

2. Verify that the Grafana service is running in your cluster
- In kubernetes, execute the following command: `kubectl get svc osm-grafana -n osm-system`

3. Open up the Grafana UI
- Ensure you are in root of the repository and execute the following script: `./scripts/port-forward-grafana.sh`
- Visit the following url [http://localhost:3000][4] in your web browser
4. The Grafana UI will request for login details, use the following default settings:
- username: admin
- password: admin
5. Viewing Grafana dashboard for service to service metrics
- From the Grafana's dashboards left hand corner navigation menu you can navigate to the OSM Service to Service Dashboard in the folder OSM Data Plane
- Or visit the following url [http://localhost:3000/d/OSMs2sMetrics/osm-service-to-service-metrics?orgId=1][6] in your web browser
OSM Service to Service Metrics dashboard will look like:

[1]: https://prometheus.io/docs/introduction/overview/
[2]: https://github.com/openservicemesh/osm/blob/release-v0.9/demo/README.md
[3]: https://grafana.com/docs/grafana/latest/getting-started/#what-is-grafana
[4]: http://localhost:3000
[5]: http://localhost:7070
[6]: http://localhost:3000/d/OSMs2sMetrics/osm-service-to-service-metrics?orgId=1
[7]: https://github.com/servicemeshinterface/smi-spec/blob/master/apis/traffic-metrics/v1alpha1/traffic-metrics.md
[8]: https://grafana.com/oss/grafana/
Feedback
Was this page helpful?
Glad to hear it! Please tell us how we can improve.
Sorry to hear that. Please tell us how we can improve.